
Adding map objects
2026-03-27Last updated
To make your maps interactive, you must add map objects. Map objects graphically represent system entities, such as cameras, doors, and intrusion detection areas, as clickable objects on maps. They let you monitor and interact with your system without leaving the map.
Before you begin
- Create the map where you want to add your map objects.
- If the map object represents an entity, make sure the entity is already defined in your Security Center SaaS system.
- For a complete list of map objects that you can add to your maps, and what the operators can do with them, see Supported map objects.
What you should know
Procedure
-
In the toolbar on the left, do one of the following:
- Click one of the Shapes or Visual objects icons to add interactive features as map objects that are not linked to any entity in your system.
- Click one of the Entities icons to add a map object linked to the entity you select. If an entity cannot be dragged onto the map, it cannot be represented by a map object.
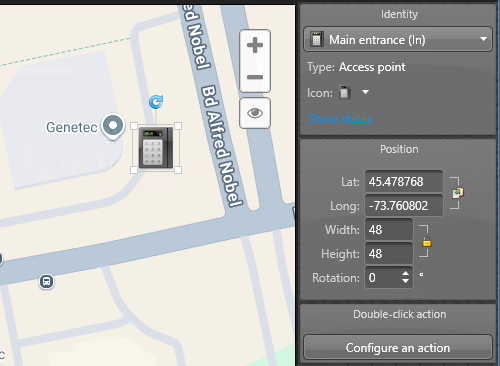
The system adds an icon that represents the map object you created, and its configurable settings appear in the right margin of the Map designer workspace.The following example shows a Reader map object and its map settings.
-
(Optional) If applicable, configure the map object's state representation on the
map.
For map objects that represent entities that can change states, such as door readers or intrusion detection areas, you can select the states you want to show and their respective colors. The following example shows the two configurable states of a Reader map object.
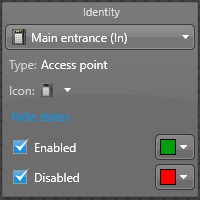
- In the Identity widget, click Show states.
- Select the states you want to monitor and their corresponding colors.
-
In the Map designer toolbar, click
Save (
 ).
).